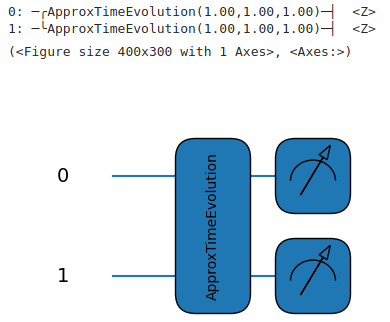
I try to plot the circuit found from qml.templates.ApproxTimeEvolution using both qml.draw and qml.draw_mpl, but it is only plotted as a black box as shown below:
Any idea why is that happening?
Here is the code:
import pennylane as qml
from pennylane.templates import ApproxTimeEvolution
n_wires = 2
wires = range(n_wires)
coeffs = [1, 1]
obs = [qml.PauliX(0), qml.PauliX(1)]
hamiltonian1 = qml.Hamiltonian(coeffs, obs)
dev = qml.device(‘default.qubit’, wires=2)
@qml.qnode(dev)
def circuit(time):
qml.templates.ApproxTimeEvolution(hamiltonian1, time, 1)
return [qml.expval(qml.PauliZ(wires=i)) for i in wires]
given_time=1
circuit(given_time)
print (qml.draw(circuit)(given_time))
qml.draw_mpl(circuit)(given_time)